osSection is a web tool for the Section Command in OpenSees. Until now, the Fiber Section (secType) has been implemented.
The UI is organized with tabs: materials and sections. The Materials tab implements osUam, the web tool for the UniaxialMaterial Command.
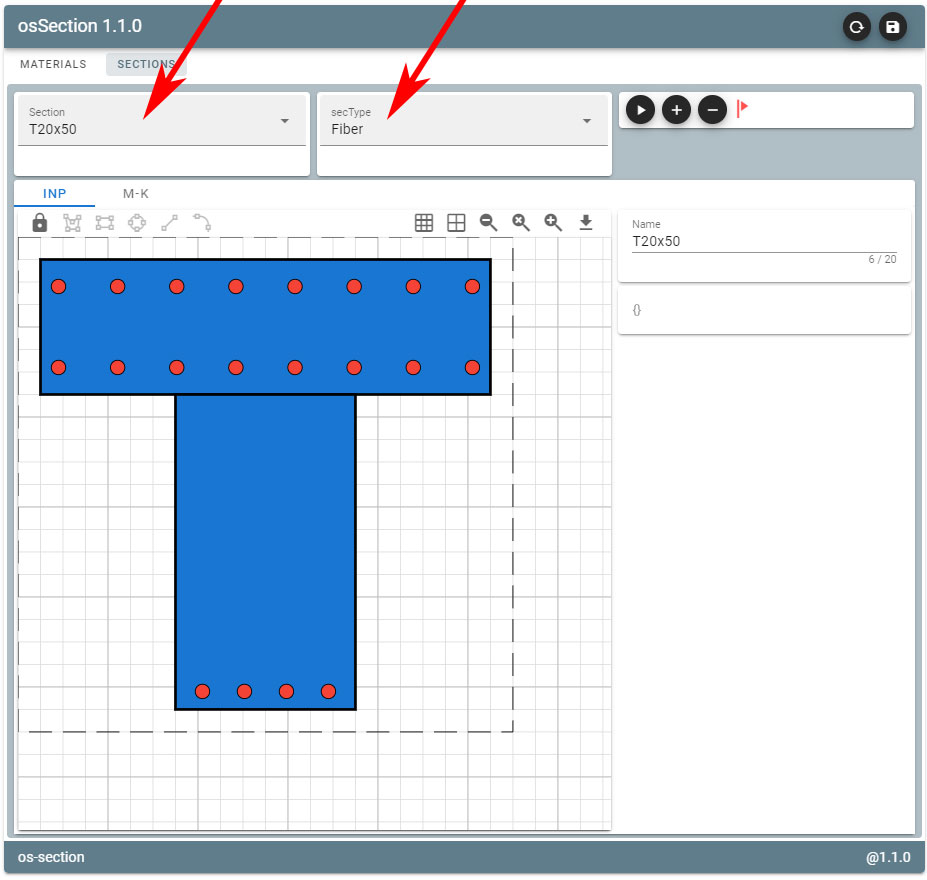
The Sections tab contains a list of Sections and Section Type (secType – only Fiber type is available).

The Fiber type interface allows to calculate the Moment-Curvature relationships of a generic cross-section. in the inp tab, several actions for the definition of the cross-section can be performed. Some of them are explained in the following.
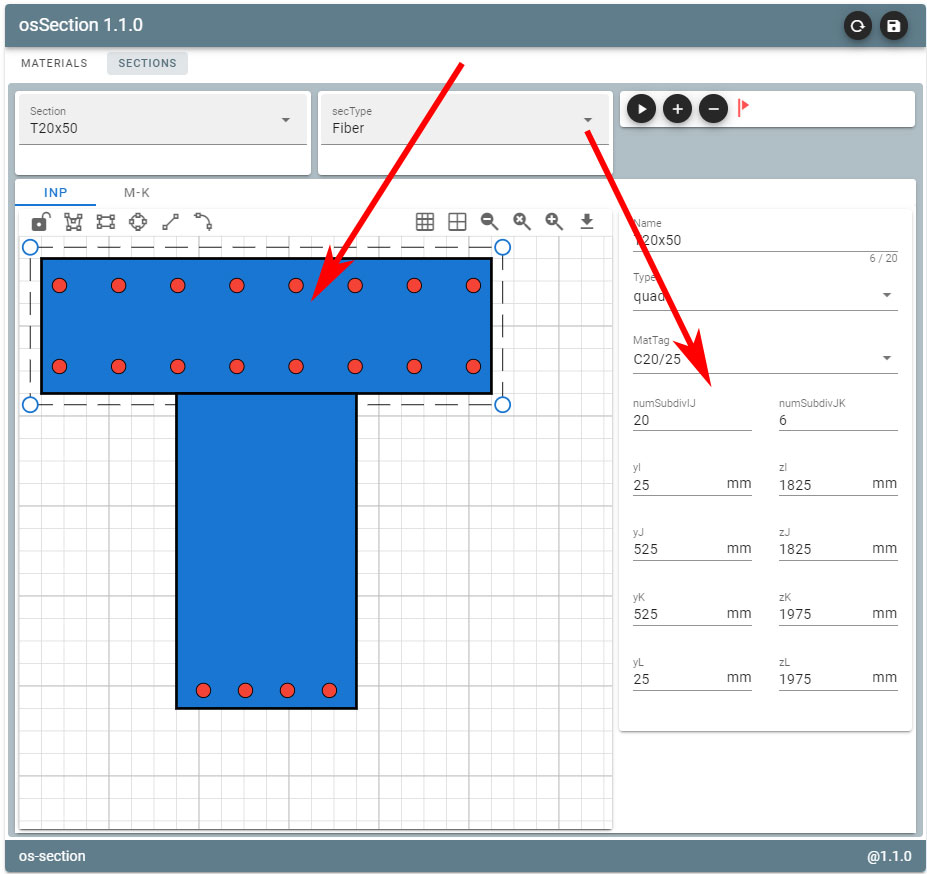
The cross-section can be formed by fiber, patch or layer. The resulting shape is shown in an interactive graphic area. A grid, activate by default, allows the user to move or stretch the whole section or a single component along the nodes of the grid.
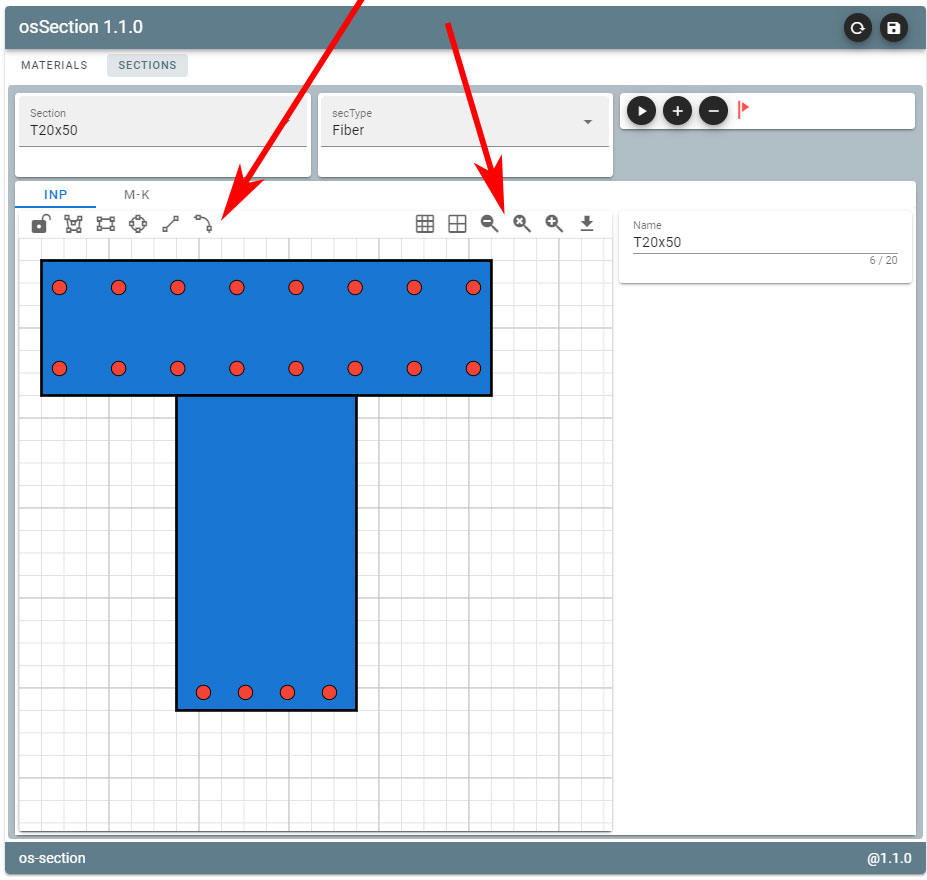
The toolbar at the top of the graphic area has several commands. Changes can be prevented by freezing the toolbar buttons. Unlocking the scene, all the components can be added, removed or modified.

The button group on the left allows to add a new component:
When a component is selected, it is surrounded by a dashed line. Moreover, some vertex can be stretched to change shape and dimensions of the component. Contextually, on the right a form, with all the parameters involved, is activated.

The button group on the rigth allows to:
- show-unshow the mesh of patch components (quad, rect, circ)
- show-unshow and resize the grid
- zooming the cross-section (also the mouse wheel can be used – not cross-browser – only Chrome)
- save the image in .png format (not cross-browser – only Chrome)
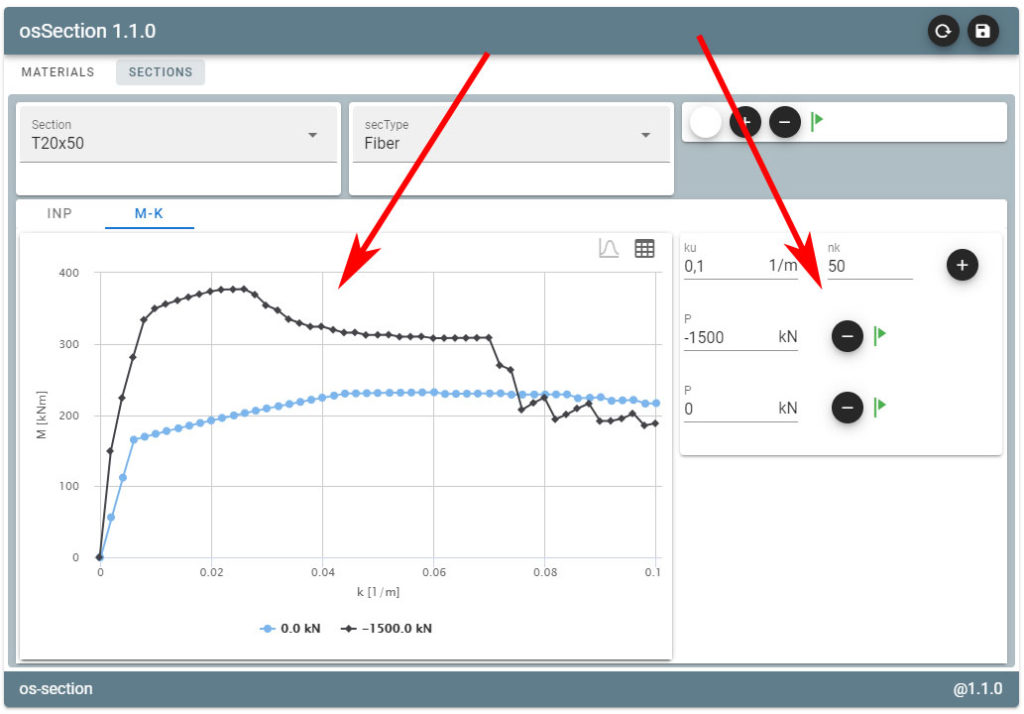
When the definition of the cross-section is completed, the play button run the analysis and the results are shown in k-M tab.

A Moment-Curvature curve for each value of axial force is plotted in the related chart. Ultimate curvature and step number analysis can be set by the form on the rigth. The web tool can analyze until to six values of axial force.
As for all charts, a table with the numerical values can be visualized and also saved in xlsx format.